Chart
Plotting charts in pyfastexcel requires multiple configurations. To ensure the accuracy of these configurations and validate the argument values, the chart functionality is implemented using pydantic models. In this section, we will introduce each chart's pydantic model and explain how to use them to plot charts in pyfastexcel.
Example
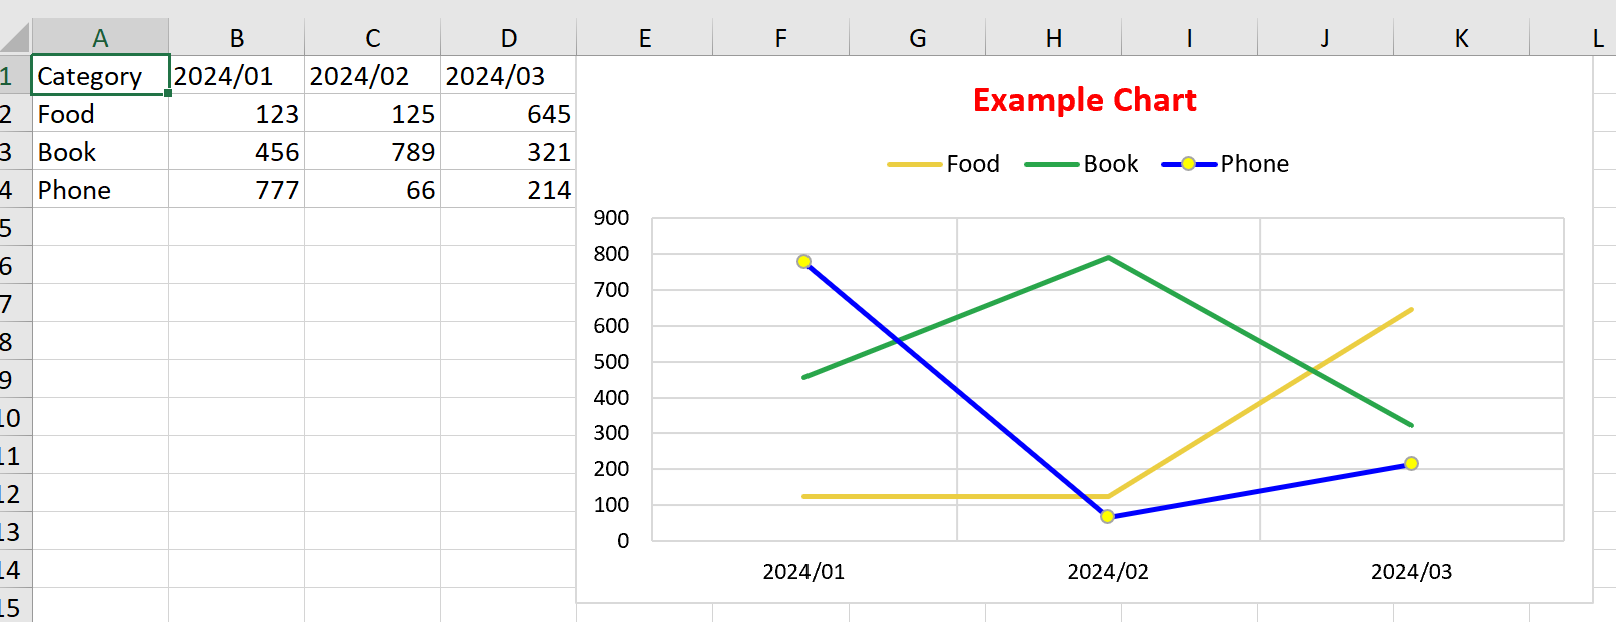
LineChart
from pyfastexcel import Workbook
from pyfastexcel.chart import (
    Chart,
    ChartSeries,
    RichTextRun,
    Font,
    ChartAxis,
    ChartLegend,
    Fill,
    Marker,
)

wb = Workbook()
ws = wb['Sheet1']

ws[0] = ['Category', '2024/01', '2024/02', '2024/03']
ws[1] = ['Food', 123, 125, 645]
ws[2] = ['Book', 456, 789, 321]
ws[3] = ['Phone', 777, 66, 214]

chart = Chart(
    chart_type='line',
    series=[
        ChartSeries(
            name='Sheet1!A2',
            categories='Sheet1!B1:D1',
            values='Sheet1!B2:D2',
            fill=Fill(ftype='pattern', pattern=1, color='ebce42'),
            marker=Marker(symbol='none'),
        ),
        ChartSeries(
            name='Sheet1!A3',
            categories='Sheet1!B1:D1',
            values='Sheet1!B3:D3',
            fill=Fill(ftype='pattern', pattern=1, color='29a64b'),
            marker=Marker(symbol='none'),
        ),
        ChartSeries(
            name='Sheet1!A4',
            categories='Sheet1!B1:D1',
            values='Sheet1!B4:D4',
            fill=Fill(ftype='pattern', pattern=1, color='0000FF'),
            marker=Marker(
                symbol='circle',
                fill=Fill(ftype='pattern', pattern=1, color='FFFF00'),
            ),
        ),
    ],
    title=[RichTextRun(text='Example Chart', font=Font(color='FF0000', bold=True))],
    x_axis=ChartAxis(major_grid_lines=True, font=Font(color='000000')),
    y_axis=ChartAxis(major_grid_lines=True, font=Font(color='000000')),
    legend=ChartLegend(position='top', show_legend_key=True),
)
ws.add_chart('E1', chart)
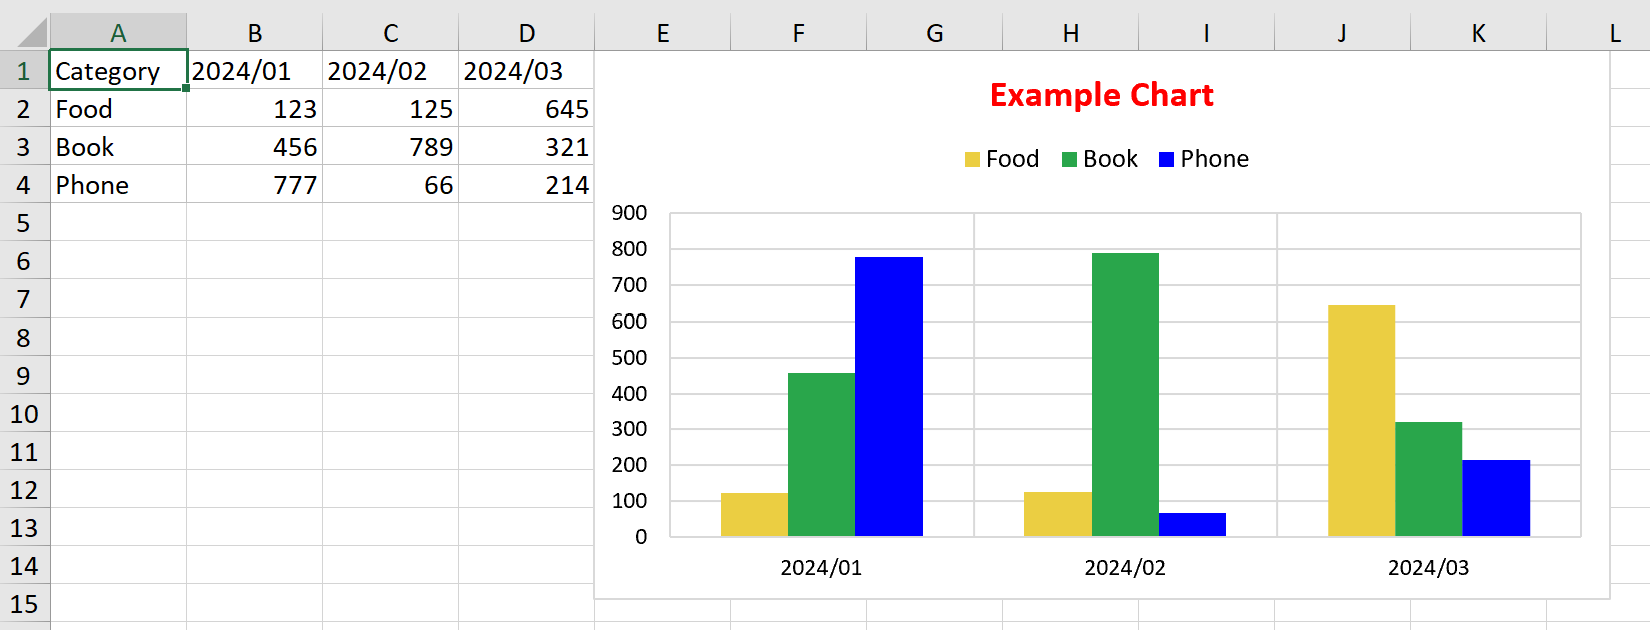
Column Chart
from pyfastexcel import Workbook
from pyfastexcel.chart import (
    Chart,
    ChartSeries,
    RichTextRun,
    Font,
    ChartAxis,
    ChartLegend,
    Fill,
    Marker,
)

wb = Workbook()
ws = wb['Sheet1']

ws[0] = ['Category', '2024/01', '2024/02', '2024/03']
ws[1] = ['Food', 123, 125, 645]
ws[2] = ['Book', 456, 789, 321]
ws[3] = ['Phone', 777, 66, 214]

chart = Chart(
    chart_type='col',
    series=[
        ChartSeries(
            name='Sheet1!A2',
            categories='Sheet1!B1:D1',
            values='Sheet1!B2:D2',
            fill=Fill(ftype='pattern', pattern=1, color='ebce42'),
        ),
        ChartSeries(
            name='Sheet1!A3',
            categories='Sheet1!B1:D1',
            values='Sheet1!B3:D3',
            fill=Fill(ftype='pattern', pattern=1, color='29a64b'),
        ),
        ChartSeries(
            name='Sheet1!A4',
            categories='Sheet1!B1:D1',
            values='Sheet1!B4:D4',
            fill=Fill(ftype='pattern', pattern=1, color='0000FF'),
        ),
    ],
    title=[RichTextRun(text='Example Chart', font=Font(color='FF0000', bold=True))],
    x_axis=ChartAxis(major_grid_lines=True, font=Font(color='000000')),
    y_axis=ChartAxis(major_grid_lines=True, font=Font(color='000000')),
    legend=ChartLegend(position='top', show_legend_key=True),
)
ws.add_chart('E1', chart)
For those who prefer a more concise style, you can try to plot chart like the following code snippet.
Note
Not all attributes support the following style. For example, the title attribute.
Check the default value of each attribute in the ChartModel and it's SubModel.
Code Snippet
from pyfastexcel import Workbook
from pyfastexcel.chart import (
    Chart,
    ChartSeries,
    RichTextRun,
    Font,
    ChartAxis,
    ChartLegend,
    Fill,
    Marker,
)

wb = Workbook()
ws = wb['Sheet1']

ws[0] = ['Category', '2024/01', '2024/02', '2024/03']
ws[1] = ['Food', 123, 125, 645]
ws[2] = ['Book', 456, 789, 321]
ws[3] = ['Phone', 777, 66, 214]

chart = Chart(chart_type='col')
chart.series = [
    ChartSeries(
        name='Sheet1!A2',
        categories='Sheet1!B1:D1',
        values='Sheet1!B2:D2',
        fill=Fill(ftype='pattern', pattern=1, color='ebce42'),
    ),
    ChartSeries(
        name='Sheet1!A3',
        categories='Sheet1!B1:D1',
        values='Sheet1!B3:D3',
        fill=Fill(ftype='pattern', pattern=1, color='29a64b'),
    ),
    ChartSeries(
        name='Sheet1!A4',
        categories='Sheet1!B1:D1',
        values='Sheet1!B4:D4',
        fill=Fill(ftype='pattern', pattern=1, color='0000FF'),
    ),
]
chart.title = [RichTextRun(text='Example Chart', font=Font(color='FF0000', bold=True))]
chart.x_axis.major_grid_lines = True
chart.x_axis.font.color = '000000'
chart.y_axis.major_grid_lines = True
chart.y_axis.font.color = '000000'
chart.legend.position = 'top'
chart.legend.show_legend_key = True

ws.add_chart('E1', chart)
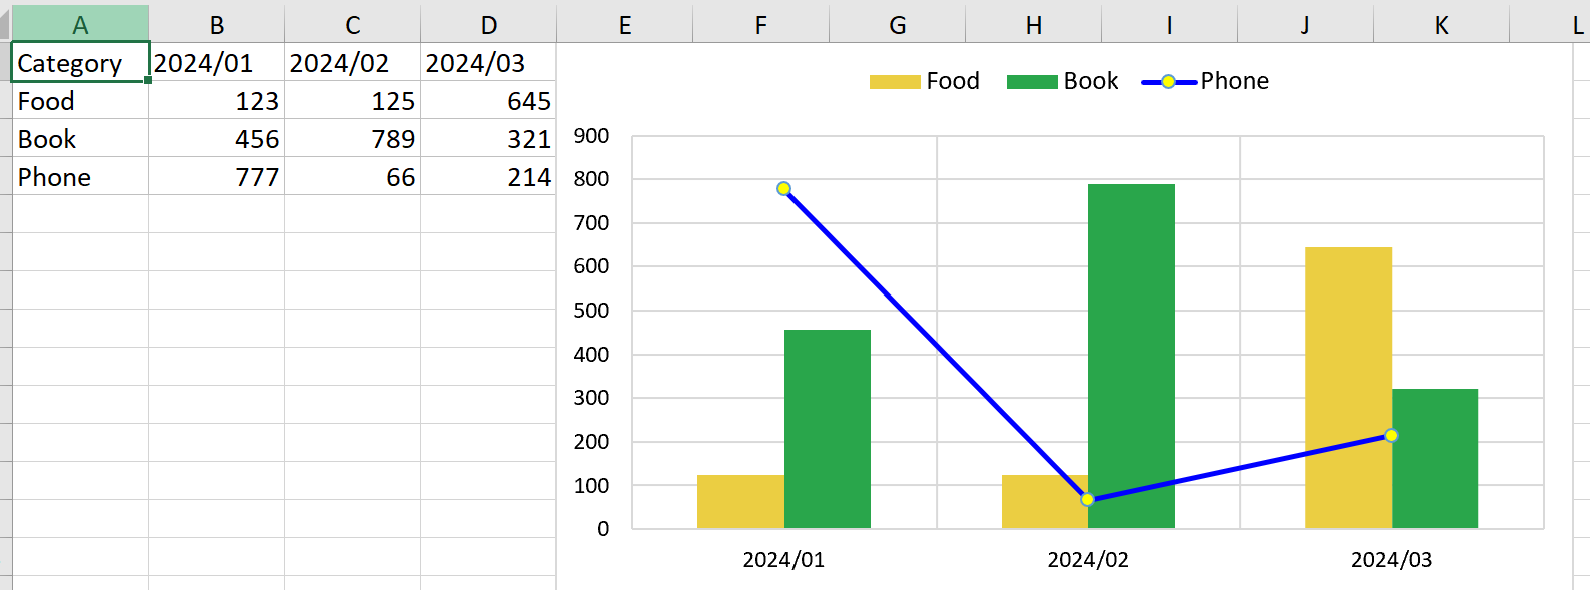
Column Chart & Line Chart
from pyfastexcel import Workbook
from pyfastexcel.chart import (
    Chart,
    ChartSeries,
    RichTextRun,
    Font,
    ChartAxis,
    ChartLegend,
    Fill,
    Marker,
)

wb = Workbook()
ws = wb['Sheet1']

ws[0] = ['Category', '2024/01', '2024/02', '2024/03']
ws[1] = ['Food', 123, 125, 645]
ws[2] = ['Book', 456, 789, 321]
ws[3] = ['Phone', 777, 66, 214]

column_chart = Chart(
    chart_type='col',
    series=[
        ChartSeries(
            name='Sheet1!A2',
            categories='Sheet1!B1:D1',
            values='Sheet1!B2:D2',
            fill=Fill(ftype='pattern', pattern=1, color='ebce42'),
            marker=Marker(symbol='none'),
        ),
        ChartSeries(
            name='Sheet1!A3',
            categories='Sheet1!B1:D1',
            values='Sheet1!B3:D3',
            fill=Fill(ftype='pattern', pattern=1, color='29a64b'),
            marker=Marker(symbol='none'),
        ),
    ],
    legend=ChartLegend(position='top', show_legend_key=True),
)

# Another coding style to plot the chart
line_chart = Chart(chart_type='line')
line_chart.series = ChartSeries(
    name='Sheet1!A4',
    categories='Sheet1!B1:D1',
    values='Sheet1!B4:D4',
    fill=Fill(ftype='pattern', pattern=1, color='0000FF'),
    marker=Marker(
        symbol='circle',
        fill=Fill(ftype='pattern', pattern=1, color='FFFF00'),
    ),
)
line_chart.title = [RichTextRun(text='Example Chart', font=Font(color='FF0000', bold=True))]
line_chart.x_axis.major_grid_lines = True
line_chart.x_axis.font.color = '000000'
line_chart.y_axis.major_grid_lines = True
line_chart.y_axis.font.color = '000000'
line_chart.legend.position = 'top'
line_chart.legend.show_legend_key = True

ws.add_chart('E1', [column_chart, line_chart])
Chart
Defines the configuration for a chart.
| Attribute | Type | Description |
|---|---|---|
chart_type |
str or ChartType |
The type of chart, such as 'bar', 'line', etc. |
series |
List[ChartSeries] or ChartSeries |
The data series to be plotted in the chart. |
graph_format |
Optional[GraphicOptions] |
Graphical options for the chart. |
title |
Optional[List[RichTextRun]] |
The title of the chart. |
legend |
Optional[ChartLegend] |
The legend settings for the chart. |
dimension |
Optional[ChartDimension] |
The dimensions of the chart. |
vary_colors |
Optional[bool] |
Specifies if colors should vary by data point. |
x_axis |
Optional[ChartAxis] |
The configuration of the X-axis. |
y_axis |
Optional[ChartAxis] |
The configuration of the Y-axis. |
plot_area |
Optional[ChartPlotArea] |
The configuration of the plot area. |
fill |
Optional[Fill] |
The fill settings for the chart. |
border |
Optional[Line] |
The border settings for the chart. |
show_blanks_as |
Optional[str] |
Specifies how blanks should be shown in the chart. |
bubble_size |
Optional[int] |
The size of bubbles in a bubble chart. |
hole_size |
Optional[int] |
The size of the hole in a doughnut chart. |
order |
Optional[int] |
The order of the series in the chart. |
ChartSeries
Defines the series within a chart, including attributes like the series name, data categories, values, and various settings for visual customization such as line styles, markers, and data labels.
| Attribute | Type | Description |
|---|---|---|
name |
str |
The name of the series (Legend). |
categories |
str |
The categories for the series (X value). |
values |
str |
The values for the series (Y value). |
sizes |
Optional[str] |
The sizes for bubble charts. |
fill |
Optional[Fill] |
Fill settings for the series. |
line |
Optional[Line] |
Line settings for the series. |
marker |
Optional[Marker] |
Marker settings for the series. |
data_label_position |
Optional[str or ChartDataLabelPosition] |
The position of data labels for the series. |
ChartDimension
Specifies the dimensions (width and height) of the chart area.
| Attribute | Type | Description |
|---|---|---|
width |
Optional[int] |
The width of the chart. |
height |
Optional[int] |
The height of the chart. |
GraphicOptions
Contains settings for graphical objects, including accessibility features, locking options, scaling, and positioning.
| Attribute | Type | Description |
|---|---|---|
alt_text |
Optional[str] |
Alternative text for accessibility. |
print_object |
Optional[bool] |
Indicates if the object should be printed. |
locked |
Optional[bool] |
Specifies if the object is locked. |
lock_aspect_ratio |
Optional[bool] |
Indicates if the aspect ratio should be locked. |
auto_fit |
Optional[bool] |
Specifies if the object should automatically fit its content. |
offset_x |
Optional[int] |
The horizontal offset of the object. |
offset_y |
Optional[int] |
The vertical offset of the object. |
scale_x |
Optional[float] |
The horizontal scale factor. |
scale_y |
Optional[float] |
The vertical scale factor. |
hyperlink |
Optional[str] |
A hyperlink associated with the object. |
hyperlink_type |
Optional[str] |
The type of hyperlink. |
positioning |
Optional[str] |
The positioning mode for the object. |
ChartPlotArea
Describes the plot area of the chart, including options for displaying bubble sizes, category names, and other visual elements.
| Attribute | Type | Description |
|---|---|---|
second_plot_values |
Optional[int] |
The number of values in a secondary plot (only for pieOfPie and barOfPie chart). |
show_bubble_size |
Optional[bool] |
Indicates if bubble sizes should be displayed. |
show_cat_name |
Optional[bool] |
Specifies if category names should be shown. |
show_leader_lines |
Optional[bool] |
Indicates if leader lines should be shown in the data label. |
show_percent |
Optional[bool] |
Specifies if percentages should be shown in the data label. |
show_ser_name |
Optional[bool] |
Indicates if series names should be displayed in the data label. |
show_val |
Optional[bool] |
Specifies if values should be shown in the data label. |
fill |
Optional[Fill] |
Fill settings for the plot area. |
num_fmt |
Optional[ChartCustomNumFmt] |
Custom number format for the plot area. |
ChartAxis
Configures the axes of the chart, including grid lines, tick labels, axis scaling, and formatting.
| Attribute | Type | Description |
|---|---|---|
none |
Optional[bool] |
Specifies if the axis should be hidden. |
font |
Optional[Font] |
Font settings for the axis labels. |
major_grid_lines |
Optional[bool] |
Specifies if major grid lines should be displayed. |
minor_grid_lines |
Optional[bool] |
Specifies if minor grid lines should be displayed. |
major_unit |
Optional[float] |
The interval between major grid lines. |
tick_label_skip |
Optional[int] |
Specifies the number of tick labels to skip between each drawn label. |
reverse_order |
Optional[bool] |
Indicates if the axis order should be reversed. |
secondary |
Optional[bool] |
Specifies if this is a secondary axis. |
maximum |
Optional[float] |
The maximum value for the axis. |
minimum |
Optional[float] |
The minimum value for the axis. |
log_base |
Optional[float] |
The logarithmic base for the axis scale. |
num_fmt |
Optional[ChartCustomNumFmt] |
Custom number format for the axis. |
title |
Optional[List[RichTextRun]] |
The title of the axis. |
ChartCustomNumFmt
Provides custom number formatting options for chart elements.
| Attribute | Type | Description |
|---|---|---|
num_fmt |
Optional[str] |
The custom number format. |
source_linked |
Optional[bool] |
Specifies if the format is linked to the source. |
RichTextRun
Defines text content and its associated font settings within chart elements.
| Attribute | Type | Description |
|---|---|---|
text |
str |
The text content. |
font |
Optional[Font] |
Font settings for the text. |
ChartLegend
Specifies the legend's position and visibility of legend keys.
| Attribute | Type | Description |
|---|---|---|
position |
Optional[Literal['none', 'top', 'bottom', 'left', 'right', 'top_right']] |
The position of the legend. |
show_legend_key |
Optional[bool] |
Specifies if the legend key should be shown. |
Line
Details the styling of lines within the chart, including line type, smoothness, width, and marker visibility.
| Attribute | Type | Description |
|---|---|---|
ltype |
Optional[str or ChartLineType] |
The type of line. |
smooth |
Optional[bool] |
Specifies if the line should be smoothed. |
width |
Optional[float] |
The width of the line. |
show_marker_line |
Optional[bool] |
Indicates if the line should be shown on markers. |
Marker
Configures markers used in the chart, including their symbols, sizes, and fill options.
| Attribute | Type | Description |
|---|---|---|
fill |
Optional[Fill] |
Fill settings for the marker. |
symbol |
Optional[str or MarkerSymbol] |
The symbol used for the marker. |
size |
Optional[int] |
The size of the marker. |
Fill
Defines the fill style for chart elements, including type (pattern or gradient), color, and shading.
| Attribute | Type | Description |
|---|---|---|
ftype |
Optional[Literal['pattern', 'gradient']] |
The type of fill, either 'pattern' or 'gradient'. |
pattern |
Optional[int] |
The pattern index for fill (0 to 18). |
color |
Optional[str] |
The fill color (supports hex color value). |
shading |
Optional[int] |
The shading index for the fill (0 to 5). |
Font
Specifies the font settings for text within the chart, including bold, color, size, and alignment.
| Attribute | Type | Description |
|---|---|---|
bold |
Optional[bool] |
Specifies if the text is bold. |
color |
Optional[str] |
The color of the text. |
family |
Optional[str] |
The font family for the text. |
italic |
Optional[bool] |
Specifies if the text is italic. |
size |
Optional[float] |
The font size for the text. |
strike |
Optional[bool] |
Specifies if the text has a strikethrough. |
underline |
Optional[str] |
The style of underline for the text. |
vert_align |
Optional[str] |
Vertical alignment for the text. |